PropertyIQ
Self-Hosted Enterprise AI & Financial Intelligence
I built a private, locally hosted LLM application that analyzes a synthetic 55-property real estate portfolio. Code calculates the financials and shows its work. A local Qwen3 model explains the results in plain English, with no external LLM inference API required.
It has since grown into a lending workbench: loan screening, document intake with OCR, borrower-versus-underwritten comparison, a debt and covenant dashboard, and an AI Lab that shows how every answer was made.
The model never does the math
Language models are good at explaining and unreliable at arithmetic. PropertyIQ splits the work so the numbers an analyst sees come from code they can audit.
PostgreSQL holds the records
Synthetic properties, monthly actuals and budgets for 55 properties across office, retail, industrial and multifamily.
Application code calculates
NOI, trailing-12-month totals, year-over-year change, budget variance and occupancy. Rule checks decide which properties are flagged.
Qwen3 explains
It receives only the verified figures and rule results, and writes a plain-English summary. It is not the authority for any number. Every dollar amount and percentage it writes is checked against those figures; if one doesn't match, a summary built in code is shown instead.
Every answer links to a calculation trail: inputs, formulas, reporting windows and the monthly record IDs behind each figure.
What the analysis found
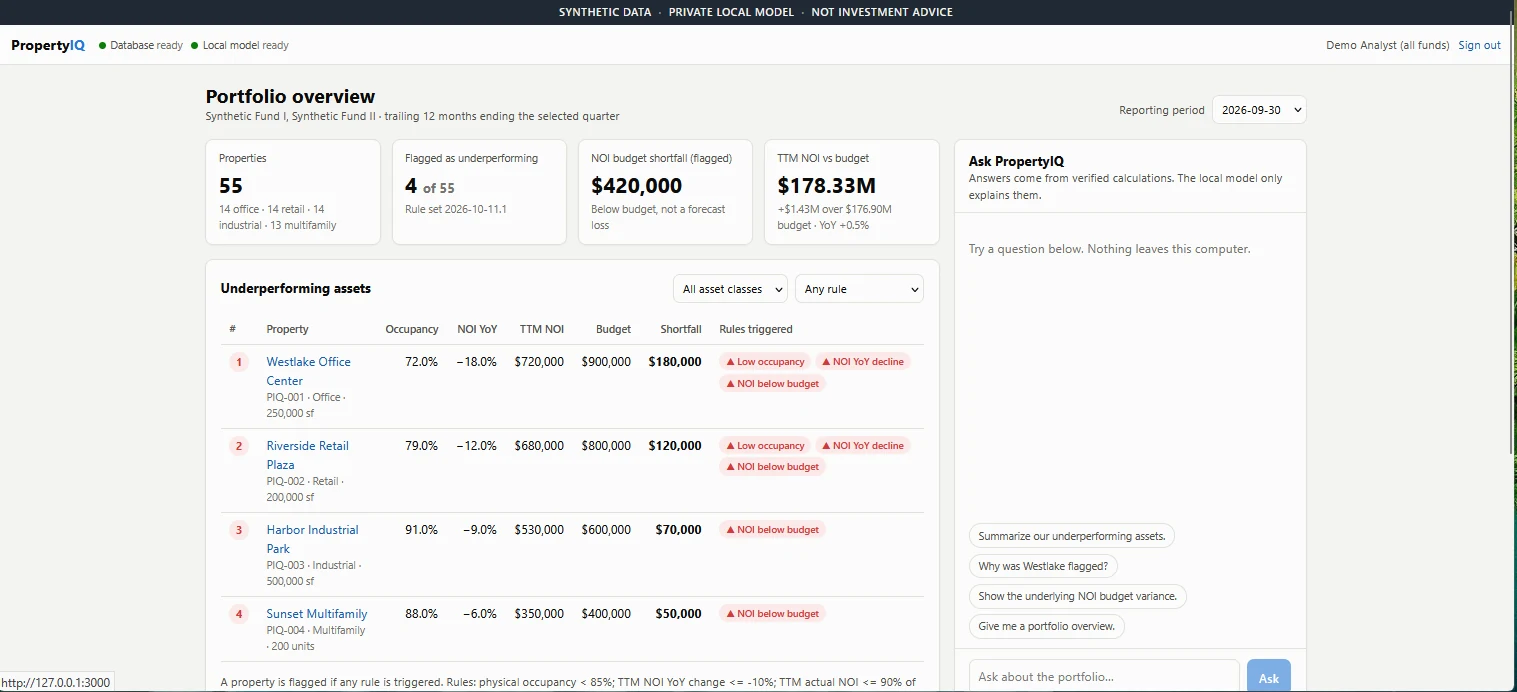
Reporting period ending September 30, 2026, using rule set 2026-10-11.1. A property is flagged if occupancy is below 85%, TTM NOI is down 10% or more year over year, or TTM NOI is at or below 90% of a positive budget.
Flagged properties
Synthetic data| Property | Occupancy | NOI YoY | TTM NOI | Budget | Shortfall | Rules triggered |
|---|---|---|---|---|---|---|
| Westlake Office Center | 72.0% | −18.0% | $720,000 | $900,000 | $180,000 | OccupancyNOI YoYBudget |
| Riverside Retail Plaza | 79.0% | −12.0% | $680,000 | $800,000 | $120,000 | OccupancyNOI YoYBudget |
| Harbor Industrial Park | 91.0% | −9.0% | $530,000 | $600,000 | $70,000 | Budget |
| Sunset Multifamily | 88.0% | −6.0% | $350,000 | $400,000 | $50,000 | Budget |
| Four flagged | $2,280,000 | $2,700,000 | $420,000 |
14 office, 14 retail, 14 industrial, 13 multifamily properties in the portfolio.
Combined shortfall of the four flagged properties only. It is a budget variance, not a forecast loss.
Whole-portfolio TTM NOI against budget, about $1.43M over. A healthy total can still hide weak assets.
Walk through the application
Real screenshots from the running prototype, in the order an analyst would use them. To click through a working simulation instead, launch the simulator demo ↗.
From portfolio analytics to a lending workbench
The same rule holds in every module: code does the arithmetic and makes the decisions, and every figure can be traced to its inputs. The loan tools use no AI for any number. All loans, deals, documents and market data are synthetic.
Screen a loan request in seconds
Enter a property and a loan request. PropertyIQ calculates the standard underwriting numbers, checks them against the lender's own guideline set and stress-tests the deal.
- NOI, DSCR (amortizing and interest-only), LTV, debt yield, implied cap rate, break-even occupancy and debt constant.
- Stress tests for rate, vacancy, income −10%, expenses +10% and exit cap +1 point.
- A one-page PDF and an Excel workbook with live formulas. Each workbook is recalculated in OpenOffice during testing and must match the app.
Read a rent roll and T-12
Upload the borrower's documents as Excel, CSV, text PDF or scanned PDF. OCR runs on the same computer.
- Every extracted row shows its source (sheet and row, or page and line) and a confidence level. Nothing is used until it is reviewed and approved.
- Tenant names and contact details are dropped while the file is read. They are never stored, shown, exported or sent to the model.
- The local model only suggests a category for an unfamiliar T-12 label. It gets the label text, never the amounts, and its suggestion is marked for review.
13 document checks, a market check and California rules
Each flag comes with a severity, the evidence numbers, where they came from and a suggested action. A flag can be dismissed only with a note.
- Document checks: rent roll versus T-12 vacancy and rent, one-time income, missing management fee, expenses below benchmark, capital items booked as repairs, missing months and totals that don't add up.
- Market check against comps from an offline synthetic provider, with a "stale" label for old data.
- California checks such as the Prop 13 tax reset, rent control, soft-story retrofit and pre-1978 lead paint. Each rule shows its official source and the date it was checked, says "may apply — verify", and anything unconfirmed is marked unverified.
The borrower's numbers next to the lender's
Flags become suggested adjustments. The analyst approves, edits or rejects each one, and every adjustment needs a reason code and a note. Both cases run through the screening engine.
"Underwriting adjustments reduce NOI by $178,195 (37.1%), moving DSCR from 1.58 to 1.00, which fails the 1.25 minimum."
That summary for the synthetic demo deal is built from the numbers in code, not written by the model. It exports as a PDF memo and an Excel workbook.
46 synthetic loans and their covenants
A portfolio view of debt: outstanding balance, fixed versus floating, weighted rate, portfolio DSCR and LTV, and covenant breaches.
- A maturity wall, a DSCR-by-LTV risk map and a covenant watchlist, plus a detail page for every loan with its calculation trail.
- Balances, debt service and ratios are never stored. They are computed from the loan terms on each request.
- Users see only the loans for funds they can access. A hidden loan returns the same "not found" as one that doesn't exist.
See how every answer was made
Each chat answer links to its trace: stage timings, the vetted function used, the number-check result, the model and token counts, and the source record IDs.
- A "model on / off" test asks the same question both ways and confirms the facts sent to the model are identical.
- Traces never store the question or the answer text, and are deleted after 30 days.
- Tabs for installed models, every vetted data function, the database schema and the offline evidence.
A live security checklist, an internet lockdown switch and tested backups
An admin-only page checks the system each time it loads and shows the evidence for every result: services listening on this computer only, database logins that can't write where they shouldn't, sign-in required on every route, no hosted-AI libraries installed, and no secrets in tracked files. A lockdown switch adds Windows Firewall rules through the Windows permission prompt, and real test connections show whether the block actually works. Each backup is restored into a scratch database and checked row by row.
Architecture and data flow
Everything inside the dashed boundary runs on one local host.
Following one question
- The analyst picks a reporting period and asks "Summarize our underperforming assets."
- The API queries PostgreSQL for the data that analyst may see.
- Code computes TTM NOI, budget variance, year-over-year change, occupancy and rule triggers.
- The API sends only those verified facts and record IDs to the local Qwen3 model.
- The model writes the summary. The interface shows it next to the formulas and source records.
- Host:
- Windows 11, with Docker Desktop on WSL 2
- Interface:
- Next.js 16 and React 19
- API:
- FastAPI (Python)
- Database:
- PostgreSQL 17 with pgvector, in Docker
- Model:
- qwen3:4b-instruct-2507 (Q4_K_M), served by Ollama
- Documents:
- RapidOCR and pdfplumber, both run locally
- Exports:
- ReportLab (PDF) and openpyxl (Excel with live formulas)
Privacy and security: what is claimed, and what is not
Running the model locally is a sound data-sovereignty design. It is not, on its own, proof of a secure system.
Designed for
- Model inference on the local host, with no external LLM API required.
- Financial records in a local PostgreSQL database.
- Deterministic calculations, separate from the model.
- Inspectable formulas and source record IDs for every figure.
- A read-only database role for the API, and portfolio access applied in the SQL itself.
- Separate database logins for writes: the screening login can change only screening tables, the trace login only the trace table, and the audit login can only add to the access audit.
- Four roles: viewers read, analysts prepare deals and propose adjustments, and credit officers approve adjustments, clear red flags and set lender policy. Every loan screening deal belongs to one fund, and a deal in a fund you can't see answers exactly like one that doesn't exist.
- An access audit of sign-ins, refusals, changes and exports, kept 90 days, with no passwords or document contents.
- Tenant names dropped when documents are read, and request traces that never store question or answer text.
- A live security checklist with evidence for each result, and backups that pass a restore test.
- An internet lockdown, tested live on the development laptop on October 12, 2026. With PropertyIQ's programs blocked, test connections from the API and the database to a public address were refused while the local model still answered questions. A whole-computer mode blocked everything.
Still to test and document
- Network isolation beyond one laptop: the lockdown has been tested once on the development machine, not in a hardened deployment.
- Production-grade sign-in: multi-factor, lockout and token revocation.
- Separation of duties beyond roles: a credit officer can still approve an adjustment they proposed.
- Encryption for data at rest and in transit.
Wording used here: self-hosted Qwen3 inference with a local PostgreSQL financial dataset, designed to operate without external LLM API calls. Offline operation can be added to this page once the disconnected test has been run and recorded.
On the resume
- Architected and built a locally hosted AI analytics prototype combining open-weight LLM inference, PostgreSQL storage and deterministic financial calculations.
- Modeled a synthetic 55-property portfolio across four asset classes. Implemented TTM NOI, year-over-year performance, occupancy, budget variance, rule-based flags and auditable source-record drill-downs.
- Designed an inference workflow that avoids external hosted LLM APIs, and documented the controls and tests needed for enterprise evaluation.